
Texas
Climate
Texas Climate


[Tyler , Longview , Lufkin], [Corpus Christi , Victoria , Laredo], [El Paso], [Lubbock], [Amarillo], [San Angelo , Abilene],
[Brownsville , McAllen], [Wichita Falls], [Houston , Galveston , College Station]

| Jan | Feb | Mar | Apr | May | June | July | Aug | Sept | Oct | Nov | Dec | Annual | |
| Avg High | 54.8 | 59.7 | 68.9 | 77.8 | 84.4 | 91.4 | 95.2 | 94.5 | 86.7 | 71.9 | 66.3 | 57.0 | 76.2 |
| Avg Low | 30.8 | 35.1 | 43.3 | 52.9 | 61.1 | 68.9 | 72.7 | 71.7 | 65.3 | 54.8 | 43.4 | 33.9 | 52.8 |
| Avg Rain | 1.03 | 1.16 | 1.36 | 1.90 | 2.97 | 2.86 | 2.09 | 2.80 | 3.21 | 2.51 | 1.48 | 1.03 | 24.4 |
| Avg Snowfall | 1.2 | 1.0 | 0.2 | - | - | - | - | - | - | - | 0.1 | 0.2 | 2.7 |
| Avg Wind | S/ 12.7 |
S/ 13.8 |
SE/ 15.0 |
SE/ 15.0 |
SE/ 15.0 |
SE/ 15.0 |
SE/ 11.5 |
SE/ 10.4 |
SE/ 11.5 |
S/ 12.7 |
S/ 12.7 |
S/ 12.7 |
SE/ 13.2 |
|
Max Wind speed |
48 |
52 | 49 | 68 | 62 | 60 | 60 | 67 | 49 | 47 | 46 | 51 | 68 |
| Avg T-storm Days | - | - | 2 | 3 | 8 | 9 | 9 | 9 | 4 | 2 | 1 | - | 56 |
| # Tornadoes in county 1950-2009 | - | - | 12 | 10 | 20 | 12 | 5 | 1 | 1 | 1 | - | - | 62 |
| Incidents in county w / hail => 1.75", 1950-2009 | - | 3 | 11 | 27 | 52 | 34 | 7 | - | 7 | 5 | - | - | 146 |
| Avg relative humidity 3pm | 44 | 44 | 37 | 38 | 43 | 41 | 38 | 37 | 43 | 43 | 42 | 43 | 41 |
| Discomfort from heat/ humidity | - | - | - | - | Med | High | High | High | Mod | - | - | - | |
| Max UV Index | Mod | Mod | High | Very High | Very High | Very High | Very High | Very High | Very High | High | Mod | Mod | |
| % possible sunshine | 61 | 64 | 70 | 71 | 70 | 78 | 79 | 77 | 70 | 72 | 67 | 62 | 70 |
| Clear Days | 11 | 10 | 12 | 11 | 10 | 13 | 14 | 14 | 14 | 15 | 13 | 12 | 150 |
| Partly cloudy days | 14 | 12 | 12 | 11 | 11 | 7 | 7 | 7 | 8 | 9 | 11 | 13 | 94 |
| Cloudy days | 11 | 10 | 12 | 11 | 10 | 13 | 14 | 14 | 14 | 15 | 13 | 12 | 121 |
| Days with fog | 1 | 1 | 1 | 1 | - | - | - | - | - | 1 | 1 | 1 | 7 |
|
Highest Temperature |
89 | 93 | 97 | 99 | 109 | 109 | 110 | 109 | 107 | 103 | 92 | 89 | 110 |
| Record hottest month, mean temp | 2006 52.2 | 1976 56.0 | 1967 63.5 | 1967 71.9 | 1998 79.1 | 1953 87.7 | 1980 89.4 | 1952 90.0 | 1977 82.5 | 1963 73.0 | 1965 62.3 | 1970 51.5 | Aug 1952, 90.0 F |
|
Lowest Temperature |
-9 | -7 | 7 | 25 | 36 | 47 | 55 | 50 | 35 | 23 | 14 | -7 | -9 |
| Record coldest month, mean temp | 1978 34.5 | 1978 38.7 | 1958 47.2 | 1973 58.6 | 1954 68.2 | 1989 75.9 | 1976 77.7 | 1971 76.8 | 1974 66.2 | 1976 56.9 | 1976 45.6 | 1983 34.2 | Dec 1983, 34.2 F |
| Avg Days above 90 | - | - | - | 1 | 5 | 21 | 28 | 27 | 15 | 3 | - | - | 100 |
| Avg Days below 32 | 14 | 8 | 3 | - | - | - | - | - | - | - | 3 | 10 | 39 |
| Jan | Feb | Mar | Apr | May | June | July | Aug | Sept | Oct | Nov | Dec | Annual | |
| Avg High | 49.0 | 52.8 | 61.6 | 71.5 | 79.1 | 87.6 | 91.7 | 89.1 | 81.8 | 72.5 | 59.7 | 50.1 | 70.5 |
| Avg Low | 21.2 | 25.5 | 32.7 | 42.7 | 51.6 | 60.7 | 65.5 | 63.8 | 56.4 | 44.5 | 32.3 | 23.7 | 43.3 |
| Avg Rain | .50 | .61 | .96 | .99 | 2.48 | 3.70 | 2.62 | 3.22 | 1.99 | 1.37 | .69 | .43 | 19.56 |
| Avg Snowfall | 4.8 | 4.1 | 1.7 | 0.8 | - | - | - | - | - | 0.4 | 2.4 | 3.7 | 17.9 |
| Avg Wind | SW/ 13.8 |
SW/ 13.8 |
SW/ 16.1 |
S/ 16.1 |
S/ 16.1 |
S/ 15.0 |
S/ 13.8 |
S/ 12.7 |
S/ 13.8 |
SW/ 13.8 |
SW/ 13.8 |
SW/ 13.8 |
S/ 14.8 |
| Max Wind speed | 56 | 58 | 63 | 74 | 61 | 68 | 60 | 59 | 52 | 64 | 63 | 57 | 68 |
| Avg T-storm Days | - | - | 2 | 3 | 8 | 9 | 9 | 9 | 4 | 2 | 1 | - | 49 |
| # Tornadoes in county 1950-2009 | - | - | 1 | 3 | 10 | 13 | 1 | 2 | 2 | 1 | - | - | 33 |
| Incidents in county w / hail => 1.75", 1950-2009 | - | - | 5 | 14 | 39 | 64 | 8 | 7 | 5 | 9 | - | - | 151 |
| Avg relative humidity 3pm | 41 | 41 | 34 | 31 | 36 | 37 | 36 | 38 | 40 | 36 | 38 | 40 | 37 |
| Discomfort from heat/humidity | - | - | - | - | - | Mod | High | High | - | - | - | - | |
| Max UV Index | Mod | Mod | High | Very High | Very High | Extr | Extr | Very High |
High | High | Mod | Low | |
| % possible sunshine | 71 | 70 | 72 | 77 | 75 | 79 | 80 | 78 | 72 | 76 | 68 | 66 | 74 |
| Clear days | 13 | 11 | 12 | 12 | 11 | 13 | 13 | 14 | 15 | 16 | 14 | 13 | 157 |
| Partly cloudy days | 7 | 7 | 8 | 9 | 10 | 11 | 12 | 10 | 7 | 7 | 7 | 7 | 104 |
| Cloudy days | 11 | 10 | 11 | 9 | 10 | 6 | 6 | 7 | 8 | 8 | 9 | 11 | 104 |
| Days with fog | 3 | 4 | 3 | 2 | 2 | 1 | 1 | 1 | 2 | 3 | 3 | 3 | 27 |
|
Highest Temperature |
81 | 88 | 94 | 98 | 103 | 108 | 105 | 105 | 103 | 99 | 87 | 81 | 108 |
| Record hottest month, mean temp | 1953 44.7 | 1954 48.6 | 2007 53.4 | 1981 63.0 | 1996 72.5 | 1953 83.3 | 2001 83.9 | 2000 81.8 | 1998 75.7 | 1963 66.1 | 1949 52.8 | 1970 43.4 | July 2001, 83.9 F |
|
Lowest Temperature |
-11 | -14 | -3 | 17 | 28 | 41 | 51 | 49 | 30 | 12 | -7 | -8 | -14 |
| Record coldest month, mean temp | 1979 24.9 | 1978 30.0 | 1958 37.0 | 1997 48.8 | 1976 60.2 | 1989 69.4 | 1950 74.3 | 1971 72.2 | 1974 62.8 | 1976 49.9 | 1972 36.9 | 1983 24.7 | Dec 1983, 24.7 F |
| Avg Days above 90 | - | - | - | 1 | 5 | 14 | 21 | 17 | 7 | 1 | - | - | 65 |
| Avg Days below 32 | 27 | 21 | 15 | 4 | - | - | - | - | - | 2 | 15 | 26 | 112 |
| Jan | Feb | Mar | Apr | May | June | July | Aug | Sept | Oct | Nov | Dec | Annual | |
| Avg High | 58.9 | 63.4 | 71.9 | 79.4 | 84.7 | 91.1 | 95.0 | 95.5 | 90.5 | 82.1 | 71.8 | 62.0 | 78.9 |
| Avg Low | 38.6 | 42.1 | 51.1 | 59.8 | 66.5 | 71.5 | 73.9 | 73.9 | 69.8 | 60.0 | 49.9 | 41.2 | 58.2 |
| Avg Rain | 1.89 | 1.99 | 2.14 | 2.51 | 5.03 | 3.81 | 1.97 | 2.31 | 2.91 | 3.97 | 2.68 | 2.44 | 33.60 |
| Avg Snowfall | 0.5 | 0.3 | - | - | - | - | - | - | - | - | 0.1 | - | 0.9 |
| Avg Wind | N/ 9.2 |
S/ 10.4 |
S/ 11.5 |
S/ 11.5 |
SE/ 11.5 |
SE/ 10.4 |
S/ 9.2 |
S/ 8.1 |
S/ 8.1 |
S/ 8.1 |
S/ 9.2 |
N/ 9.2 |
S/ 9.7 |
| Max Wind speed | 52 | 55 | 56 | 51 | 63 | 54 | 44 | 47 | 81 | 46 | 49 | 63 | 81 |
| Avg T-storm Days | 1 | 2 | 3 | 5 | 7 | 5 | 4 | 5 | 4 | 3 | 2 | 1 | 41 |
| # Tornadoes in county 1950-2009 | 1 | - | 10 | 6 | 17 | 3 | 2 | 5 | 7 | 2 | 6 | 1 | 60 |
| Incidents in county w/ hail => 1.75" 1950-2009 | - | 3 | 32 | 23 | 45 | 8 | - | 1 | 4 | 5 | - | - | 121 |
| Avg relative humidity 3pm | 53 | 51 | 47 | 50 | 53 | 49 | 43 | 42 | 47 | 47 | 47 | 49 | 48 |
| Discomfort from heat/humidity | - | - | - | Mod | Med | High | High | High | High | Med | - | - | |
| Max UV Index | Mod | High | Very High | Very High | Extr | Extr | Extr | Extr | Very High | High | Mod | Mod | |
| % possible Sunshine | 48 | 51 | 55 | 54 | 56 | 69 | 75 | 75 | 66 | 64 | 55 | 49 | 60 |
| Clear days | 9 | 8 | 9 | 8 | 7 | 8 | 12 | 12 | 11 | 13 | 11 | 10 | 116 |
| Partly cloudy days | 6 | 6 | 8 | 8 | 11 | 15 | 13 | 14 | 11 | 9 | 7 | 6 | 114 |
| Cloudy days | 16 | 14 | 14 | 14 | 13 | 7 | 6 | 5 | 8 | 9 | 12 | 15 | 135 |
| Days with fog | 3 | 3 | 3 | 1 | 1 | 0 | 1 | 0 | 1 | 2 | 3 | 3 | 21 |
|
Highest Temperature |
90 | 98 | 98 | 98 | 104 | 108 | 108 | 110 | 112 | 100 | 91 | 90 | 112 |
| Record hottest month, mean temp | 1952 59.1 | 1999 62.3 | 1967 67.3 | 1967 75.9 | 1996 80.6 | 2008 87.4 | 2009 89.5 | 2009 89.1 | 2005 84.4 | 1931 77.2 | 1973 65.1 | 1933 58.9 | July 2009, 89.5 |
|
Lowest Temperature |
-2 | -1 | 18 | 30 | 40 | 51 | 57 | 58 | 41 | 30 | 20 | 4 | -2 |
| Record coldest month, mean temp | 1940 38.6 | 1978 45.0 | 1965 53.4 | 1931 62.8 | 1979 71.4 | 1940 76.6 | 1976 80.2 | 1971 81.2 | 1974 72.2 | 1976 61.3 | 1976 51.6 | 1983 41.9 | Jan 1940, 38.6 |
| Avg Days above 90 | - | - | 1 | 2 | 7 | 22 | 28 | 28 | 18 | 4 | - | - | 111 |
| Avg Days below 32 | 8 | 4 | 1 | - | - | - | - | - | - | - | 1 | 5 | 19 |
| Jan | Feb | Mar | Apr | May | June | July | Aug | Sept | Oct | Nov | Dec | Annual | |
| Avg High | 68.9 | 66.1 | 74.5 | 81.4 | 87.0 | 92.4 | 96.2 | 97.2 | 91.2 | 83.3 | 73.5 | 64.3 | 80.7 |
| Avg Low | 49.9 | 52.5 | 59.1 | 66.5 | 72.0 | 74.9 | 75.7 | 75.4 | 73.2 | 66.1 | 59.0 | 52.4 | 64.7 |
| Avg Rain | 1.36 | 1.18 | .93 | 1.96 | 2.48 | 2.99 | 1.77 | 2.99 | 5.31 | 3.78 | 1.75 | 1.11 | 27.55 |
| Avg Snowfall | - | - | - | - | - | - | - | - | - | - | - | - | 0 |
| Avg Wind | NW/ 12.7 |
SE/ 17.3 |
SE/ 17.3 |
SE/ 17.3 |
SE/ 15.0 |
SE/ 13.8 |
SE/ 12.7 |
SE/ 11.5 |
SE/ 10.4 |
SE/ 10.4 |
SE/ 13.8 |
NW/ 12.7 |
SE/ 13.7 |
| Max Wind speed | 47 | 38 | 44 | 43 | 45 | 36 | 37 | 36 | 55 | 40 | 44 | 39 | 55 |
| Avg T-storm Days | 1 | 1 | 1 | 2 | 3 | 3 | 3 | 5 | 5 | 2 | 1 | - | 26 |
| # Tornadoes in county 1950-2009 | - | 1 | - | 6 | 12 | 5 | 3 | 11 | 8 | 1 | 5 | 1 | 53 |
| Incidents in county w/ hail => 1.75" 1950-2009 | - | 2 | 5 | 14 | 14 | - | - | - | 1 | - | - | - | 36 |
| Avg relative humidity 3pm | 62 | 60 | 57 | 58 | 60 | 59 | 54 | 55 | 60 | 58 | 59 | 61 | 59 |
| Discomfort from heat/humidity | - | - | - | Mod | High | High | High | High | High | High | - | - | |
| Max UV Index | Mod | High | Very High | Extr | Extr | Extr | Extr | Extr | Very High | Very High |
High | Mod | |
| % possible Sunshine | 41 | 48 | 53 | 58 | 64 | 73 | 80 | 76 | 68 | 65 | 51 | 42 | 60 |
| Clear days | 6 | 7 | 7 | 5 | 6 | 9 | 11 | 10 | 9 | 11 | 9 | 7 | 96 |
| Partly cloudy days | 7 | 6 | 8 | 10 | 14 | 15 | 14 | 14 | 13 | 12 | 9 | 7 | 131 |
| Cloudy days | 18 | 15 | 16 | 15 | 11 | 6 | 6 | 7 | 8 | 8 | 12 | 17 | 138 |
| Days with fog | 6 | 5 | 4 | 2 | 1 | - | - | - | 0 | 1 | 3 | 5 | 27 |
|
Highest Temperature |
91 | 94 | 106 | 102 | 102 | 103 | 103 | 104 | 105 | 99 | 98 | 94 | 106 |
| Record hottest month, mean temp | 1950 68.7 | 1962 70.4 | 1953 74.9 | 1967 80.1 | 1978 83.2 | 1998 87.2 | 1980 87.5 | 2010 87.1 | 1900 84.9 | 2004 80.4 | 1909 74.7 | 1984 70.2 | July 1980, 87.5 F |
|
Lowest Temperature |
18 | 12 | 28 | 37 | 41 | 56 | 57 | 63 | 51 | 35 | 27 | 16 | 12 |
| Record coldest month, mean temp | 1966 54.3 | 1905 52.9 | 1915 59.1 | 1931 67.9 | 1901 73.8 | 1913 78.3 | 1901 81.0 | 1973 81.5 | 1979 77.7 | 1976 70.1 | 1976 60.8 | 1989 51.8 | Dec 1989, 51.8 F |
| Avg Days above 90 | - | - | 1 | 3 | 9 | 23 | 28 | 28 | 19 | 5 | - | - | 116 |
| Avg Days below 32 | 1 | - | - | - | - | - | - | - | - | - | - | 1 | 2 |
| Jan | Feb | Mar | Apr | May | June | July | Aug | Sept | Oct | Nov | Dec | Annual | |
| Avg High | 65.0 | 69.0 | 75.7 | 81.7 | 86.2 | 90.4 | 93.3 | 93.4 | 89.7 | 83.9 | 75.8 | 68.3 | 81.0 |
| Avg Low | 45.3 | 48.0 | 55.3 | 63.2 | 69.5 | 73.4 | 74.8 | 75.0 | 72.3 | 63.9 | 55.6 | 48.4 | 62.1 |
| Avg Rain | 1.62 | 1.84 | 1.74 | 2.05 | 3.48 | 3.538 | 2.00 | 3.54 | 5.03 | 3.94 | 1.74 | 1.75 | 32.26 |
| Avg Snowfall | - | - | - | - | - | - | - | - | - | - | - | - | 0 |
| Avg Wind | N/ 15.0 |
SE/ 16.1 |
SE/ 17.3 |
SE/ 15.0 |
SE/ 13.8 |
SE/ 12.7 |
SE/ 12.7 |
SE/ 12.7 |
SE/ 11.5 |
SE/ 10.4 |
SE/ 13.8 |
SE/ 15.0 |
SE/ 13.8 |
| Max Wind Speed | 52 | 60 | 54 | 67 | 60 | 61 | 49 | 48 | 61 | 53 | 60 | 54 | 67 |
| Avg T-storm Days | 1 | 1 | 2 | 2 | 5 | 3 | 3 | 4 | 5 | 2 | 1 | 1 | 29 |
| # Tornadoes in county 1950-2009 | - | 1 | 3 | 8 | 14 | 12 | 8 | 19 | 17 | 11 | 1 | 1 | 95 |
| Incidents in county w hail => 1.75", 1950-2009 | - | - | 1 | - | 14 | 1 | - | - | 2 | 1 | - | - | 19 |
| Avg relative humidity 3pm | 62 | 59 | 57 | 61 | 64 | 62 | 56 | 56 | 60 | 57 | 58 | 60 | 59 |
| Discomfort from heat/humidity | - | - | - | Mod | High | High | High | High | High | High | - | - | |
| Max UV Index | High | High | Very High | Extr | Extr | Extr | Extr | Extr | Very High | Very High | High | Mod | |
| % possible Sunshine | 44 | 49 | 55 | 56 | 59 | 72 | 80 | 77 | 68 | 68 | 54 | 44 | 61 |
| Clear Days | 7 | 7 | 7 | 6 | 6 | 9 | 11 | 11 | 10 | 13 | 9 | 8 | 103 |
| Partly cloudy days | 7 | 6 | 8 | 9 | 12 | 14 | 14 | 13 | 12 | 10 | 9 | 6 | 121 |
| Cloudy days | 17 | 15 | 16 | 15 | 13 | 7 | 6 | 7 | 8 | 8 | 12 | 17 | 142 |
| Days with fog | 6 | 5 | 4 | 3 | 1 | - | - | - | - | 1 | 4 | 5 | 29 |
|
Highest Temperature |
94 | 97 | 102 | 102 | 103 | 106 | 105 | 104 | 109 | 98 | 98 | 91 | 109 |
| Record hottest month, mean temp | 1950 65.9 | 1962 67.5 | 1953 71.8 | 2006 77.6 | 1989 81.9 | 1998 85.8 | 2009 87.9 | 2009 87.6 | 1977 85.4 | 2004 80.0 | 1973 72.9 | 1970 66.9 | July 2009, 87.9 |
|
Lowest Temperature |
14 | 11 | 24 | 33 | 44 | 56 | 64 | 64 | 52 | 28 | 28 | 13 | 13 |
| Record coldest month, mean temp | 1978 49.1 | 1978 51.7 | 1969 57.8 | 1959 68.1 | 1976 74.4 | 1966 79.5 | 1976 81.2 | 1967 81.4 | 1967 81.4 | 1976 67.3 | 1976 57.3 | 1989 48.0 | Dec 1989, 48.0 |
| Avg Days above 90 | - | - | 1 | 2 | 5 | 20 | 28 | 28 | 17 | 5 | - | - | 106 |
| Avg Days below 32 | 3 | 1 | - | - | - | - | - | - | - | - | - | 1 | 5 |
| Jan | Feb | Mar | Apr | May | June | July | Aug | Sept | Oct | Nov | Dec | Annual | |
| Avg High | 54.1 | 58.9 | 67.8 | 76.3 | 82.9 | 91.9 | 96.5 | 96.2 | 87.8 | 78.5 | 66.8 | 57.5 | 76.3 |
| Avg Low | 32.7 | 36.9 | 45.6 | 54.7 | 62.6 | 70.0 | 74.1 | 73.6 | 66.9 | 55.8 | 45.4 | 36.3 | 54.6 |
| Avg Rain | 1.83 | 2.18 | 2.77 | 3.50 | 4.88 | 2.98 | 2.31 | 2.21 | 3.39 | 3.52 | 2.29 | 1.84 | 33.70 |
| Avg Snowfall | 0.8 | 1.2 | 0.1 | - | - | - | - | - | - | - | 0.2 | 0.2 | 2.5 |
| Avg Wind | S/ 10.8 |
S/ 11.2 |
S/ 12.1 |
S/ 12.1 |
S/ 11.3 |
S/ 10.3 |
S/ 10.0 |
S/ 8.6 |
S/ 8.7 |
S/ 9.7 |
S/ 10.7 |
S/ 10.4 |
S/ 10.5 |
| Max wind speed | 54 | 78 | 74 | 75 | 67 | 64 | 53 | 47 | 49 | 54 | 54 | 48 | 78 |
| Avg T-storm Days | 1 | 2 | 4 | 6 | 8 | 6 | 5 | 5 | 3 | 3 | 2 | 1 | 46 |
| # Tornadoes in county 1950-2009 | 8 | 1 | 9 | 18 | 18 | 4 | 2 | 1 | 2 | 11 | 2 | 7 | 83 |
| Incidents in county w / hail => 1.75", 1950-2009 | 1 | 8 | 23 | 50 | 41 | 9 | 7 | 3 | 3 | 16 | 3 | 0 | 164 |
| Avg relative humidity 3pm | 52 | 51 | 48 | 50 | 53 | 47 | 42 | 41 | 46 | 47 | 49 | 51 | 48 |
| Discomfort from heat/humidity | - | - | - | Mod | Med | High | High | High | Med | Mod | - | - | |
| Max UV Index | Mod | Mod | High | Very High | Very High | Very High | Very High | Very High | Very High | High | Mod | Mod | |
| % possible Sunshine | 52 | 54 | 58 | 61 | 57 | 67 | 75 | 73 | 67 | 63 | 57 | 52 | 61 |
| Clear days | 10 | 10 | 10 | 9 | 8 | 11 | 15 | 15 | 13 | 14 | 12 | 11 | 136 |
| Partly cloudy days | 6 | 5 | 8 | 8 | 10 | 11 | 10 | 10 | 9 | 7 | 6 | 6 | 97 |
| Cloudy days | 15 | 13 | 13 | 13 | 13 | 8 | 6 | 6 | 8 | 10 | 12 | 14 | 133 |
| Days with fog | 2 | 2 | 1 | 1 | 1 | - | - | - | - | 1 | 2 | 2 | 12 |
|
Highest Temperature |
93 | 96 | 100 | 101 | 107 | 113 | 110 | 112 | 111 | 106 | 89 | 90 | 113 |
| Record hottest month, mean temp | 2006 55.8 | 1976 59.3 | 1907 66.9 | 2006 72.7 | 1996 80.7 | 1953 87.6 | 1980 90.9 | 2010 90.8 | 2005 84.6 | 1963 73.1 | 1913 62.9 | 1970 55.5 | July 1980, 90.9 |
|
Lowest Temperature |
-2 | -8 | 10 | 29 | 34 | 48 | 56 | 55 | 40 | 24 | 19 | -1 | -8 |
| Record coldest month, mean temp | 1978 34.7 | 1905 35.8 | 1915 46.4 | 1983 60.4 | 1907 65.9 | 1903 73.3 | 1905 79.5 | 1906 80.0 | 1974 69.2 | 1976 61.0 | 1959 49.8 | 1983 35.6 | Jan 1978, 34.7 |
| Avg Days above 90 | - | - | - | 1 | 5 | 21 | 28 | 27 | 15 | 3 | - | - | 100 |
| Avg Days below 32 | 14 | 8 | 3 | - | - | - | - | - | - | - | 3 | 10 | 39 |
| Jan | Feb | Mar | Apr | May | June | July | Aug | Sept | Oct | Nov | Dec | Annual | |
| Avg High | 61.5 | 65.2 | 72.4 | 79.2 | 84.8 | 89.9 | 92.3 | 92.3 | 88.1 | 81.4 | 72.4 | 64.7 | 78.7 |
| Avg Low | 42.9 | 45.5 | 52.7 | 60.7 | 67.0 | 72.6 | 74.6 | 74.6 | 71.2 | 61.2 | 52.8 | 45.4 | 60.1 |
| Avg Rain | 3.63 | 3.11 | 2.80 | 3.07 | 5.20 | 6.41 | 4.82 | 4.53 | 5.45 | 4.19 | 4.22 | 3.40 | 50.83 |
| Avg Snowfall | 0.2 | 0.2 | - | - | - | - | - | - | - | - | - | - | 0.4 |
| Avg Wind | N/ 9.2 |
N/ 9.2 |
SE/ 11.5 |
SE/ 11.5 |
SE/ 10.4 |
SE/ 10.4 |
S/ 8.1 |
S/ 9.2 |
SE/ 6.9 |
SE/ 9.2 |
SE/ 8.1 |
N/ 9.2 |
NE/ 9.4 |
| Max Wind speed | 44 | 61 | 51 | 56 | 52 | 68 | 52 | 78 | 44 | 58 | 46 | 56 | 78 |
| Avg T-storm Days | 2 | 2 | 4 | 3 | 7 | 8 | 11 | 10 | 7 | 4 | 3 | 2 | 61 |
| # Tornadoes in county 1950-2009 | 9 | 17 | 10 | 19 | 34 | 17 | 7 | 20 | 15 | 22 | 33 | 10 | 213 |
| Incidents in county w / hail => 1.75", 1950-2009 | 1 | 3 | 9 | 23 | 37 | 3 | 2 | - | 1 | 4 | 1 | 1 | 84 |
| Avg relative humidity 3pm | 58 | 55 | 54 | 54 | 57 | 56 | 55 | 55 | 57 | 53 | 55 | 57 | 55 |
| Discomfort from heat/humidity | - | - | - | Mod | Med | High | High | High | High | Med | - | - | |
| Max UV Index | Mod | High | Very High | Very High | Very High | Extr | Extr | Extr | Very High | High | High | Mod | |
| % possible Sunshine | 43 | 49 | 52 | 56 | 60 | 66 | 68 | 67 | 65 | 63 | 51 | 50 | 58 |
| Clear days | 7 | 7 | 7 | 7 | 6 | 7 | 7 | 6 | 8 | 11 | 9 | 8 | 91 |
| Partly cloudy days | 5 | 6 | 7 | 7 | 11 | 13 | 16 | 17 | 12 | 9 | 7 | 5 | 114 |
| Cloudy days | 19 | 15 | 17 | 16 | 14 | 10 | 8 | 8 | 10 | 11 | 14 | 18 | 160 |
| Days with fog | 4 | 3 | 3 | 2 | 2 | 1 | - | - | 1 | 3 | 3 | 4 | 26 |
|
Highest Temperature |
84 | 91 | 91 | 95 | 97 | 103 | 105 | 107 | 109 | 96 | 89 | 85 | 109 |
| Record hottest month, mean temp | 2006 58.5 | 2000 62.2 | 1907 72.2 | 2006 72.2 | 2003 78.9 | 1998 83.5 | 2009 84.9 | 2010 85.7 | 2005 81.9 | 2004 75.7 | 1994 65.7 | 2007 59.2 | Aug 2010, 85.7 |
|
Lowest Temperature |
12 | 20 | 22 | 31 | 44 | 52 | 62 | 60 | 48 | 29 | 19 | 7 | 7 |
| Record coldest month, mean temp | 1906 47.7 | 2010 48.4 | 1906 55.7 | 1907 62.8 | 1907 67.6 | 1995 78.4 | 2007 80.2 | 1992 78.3 | 1994 75.1 | 1906 62.5 | 1992 55.4 | 2000 48.9 | Jan 1906, 47.7 |
| Avg Days above 90 | - | - | - | 1 | 5 | 20 | 27 | 26 | 15 | 3 | - | - | 97 |
| Avg Days below 32 | 7 | 4 | 1 | - | - | - | - | - | - | - | 2 | 5 | 19 |
| Jan | Feb | Mar | Apr | May | June | July | Aug | Sept | Oct | Nov | Dec | Annual | |
| Avg High | 52.9 | 57.6 | 66.0 | 75.4 | 83.1 | 90.0 | 91.9 | 89.6 | 82.9 | 74.7 | 63.2 | 54.1 | 73.5 |
| Avg Low | 24.6 | 28.6 | 36.4 | 46.7 | 55.8 | 64.3 | 68.0 | 66.2 | 59.4 | 48.1 | 36.5 | 27.2 | 46.8 |
| Avg Rain | .39 | .68 | .89 | .97 | 2.35 | 2.75 | 2.37 | 2.51 | 2.60 | 1.86 | .75 | .53 | 18.65 |
| Avg Snowfall | 2.4 | 2.9 | 1.5 | 0.2 | - | - | - | - | - | 0.2 | 1.2 | 1.9 | 10.3 |
| Avg Wind | SW/ 11.5 |
SW/ 12.7 |
SW/ 13.8 |
S/ 15.0 |
SE/ 15.0 |
S/ 13.8 |
S/ 12.7 |
S/ 11.5 |
S/ 11.5 |
S/ 11.5 |
SW/ 11.5 |
SW/ 12.7 |
S/ 12.8 |
| Max Wind speed | 59 | 64 | 77 | 71 | 74 | 85 | 72 | 59 | 58 | 52 | 63 | 64 | 85 |
| Avg T-storm Days | - | - | 2 | 4 | 9 | 9 | 8 | 7 | 5 | 3 | 1 | - | 47 |
| # Tornadoes in county 1950-2009 | - | - | 9 | 16 | 30 | 16 | 5 | 6 | 2 | - | 3 | 2 | 89 |
| Incidents in county w / hail => 1.75", 1950-2009 | 0 | 2 | 13 | 24 | 93 | 81 | 7 | 4 | 12 | 5 | 0 | 0 | 240 |
| Discomfort from heat/humidity | - | - | - | - | - | High | High | High | - | - | - | - | |
| Max UV Index | Mod | Mod | High | Very High | Very High | Very High | Extr | Very High | Very High | High | Mod | Mod | |
| Avg relative humidity 3pm | 41 | 40 | 32 | 30 | 35 | 36 | 39 | 41 | 44 | 39 | 38 | 40 | 38 |
| % possible Sunshine | 65 | 66 | 73 | 74 | 71 | 75 | 77 | 76 | 71 | 75 | 68 | 65 | 71 |
| Clear days | 13 | 11 | 12 | 12 | 11 | 13 | 14 | 15 | 14 | 17 | 15 | 13 | 160 |
| Partly cloudy days | 6 | 7 | 9 | 9 | 11 | 11 | 11 | 10 | 8 | 6 | 7 | 7 | 102 |
| Cloudy days | 12 | 10 | 10 | 9 | 9 | 6 | 6 | 6 | 8 | 8 | 8 | 11 | 103 |
| Days with fog | 7 | 7 | 5 | 4 | 6 | 3 | 2 | 3 | 6 | 6 | 6 | 6 | 61 |
|
Highest Temperature |
87 | 89 | 95 | 100 | 109 | 114 | 109 | 107 | 105 | 98 | 89 | 83 | 114 |
| Record hottest month, mean temp | 1914 48.5 | 1932 51.5 | 1974 58.5 | 1946 67.1 | 1996 76.7 | 1990 84.4 | 1966 85.4 | 1943 82.3 | 1931 77.5 | 1934 66.2 | 1965 57.3 | 1933 48.0 | July 1966, 85.4 |
|
Lowest Temperature |
-16 | -17 | -2 | 18 | 29 | 39 | 49 | 43 | 33 | 18 | -1 | -2 | -17 |
| Record coldest month, mean temp | 1930 30.7 | 1978 33.9 | 1915 39.5 | 1920 53.5 | 1917 63.2 | 1920 68.5 | 1976 75.0 | 1920 73.0 | 1974 63.9 | 1976 5.0 | 1972 42.4 | 1983 31.7 | Jan 1930, 30.7 |
| Avg Days above 90 | - | - | - | 2 | 8 | 18 | 23 | 20 | 9 | 1 | - | - | 80 |
| Avg Days below 32 | 25 | 19 | 11 | 2 | - | - | - | - | - | 1 | 12 | 23 | 92 |
| Jan | Feb | Mar | Apr | May | June | July | Aug | Sept | Oct | Nov | Dec | Annual | |
| Avg High | 56.5 | 61.6 | 71.2 | 79.8 | 87.4 | 93.4 | 95.4 | 94.1 | 85.4 | 71.3 | 66.2 | 58.4 | 77.2 |
| Avg Low | 28.5 | 32.6 | 40.2 | 49.4 | 58.1 | 65.7 | 68.5 | 67.5 | 61.1 | 50.6 | 38.9 | 30.8 | 49.3 |
| Avg Rain | .40 | .62 | .58 | .83 | 1.98 | 1.55 | 1.70 | 1.69 | 2.62 | 1.74 | .69 | .56 | 14.96 |
| Avg Snowfall | 1.8 | 0.9 | 0.4 | - | - | - | - | - | - | - | 0.4 | 0.8 | 4.3 |
| Avg Wind | S/ 9.2 |
S/ 10.4 |
S/ 12.7 |
S/ 12.7 |
S/ 13.8 |
S/ 12.7 |
SE/ 11.5 |
SE/ 10.4 |
S/ 10.4 |
S/ 11.5 |
S/ 10.4 |
S/ 10.4 |
S/ 11.3 |
| Max Wind speed | 59 | 55 | 74 | 67 | 74 | 71 | 82 | 63 | 82 | 69 | 59 | 47 | 82 |
| Avg T-storm Days | - | - | 1 | 3 | 7 | 6 | 6 | 6 | 4 | 3 | 1 | - | 37 |
| # Tornadoes in county 1950-2009 | - | - | 2 | 3 | 12 | 5 | 1 | 3 | 3 | 1 | - | - | 30 |
| Incidents in county w/ hail => 1.75" 1950-2009 | 1 | - | 5 | 9 | 38 | 21 | 2 | 2 | 4 | 13 | - | - | 95 |
| Discomfort from heat/humidity | - | - | - | - | - | High | High | High | Mod | - | - | - | |
| Avg relative humidity 3pm | 38 | 35 | 27 | 28 | 30 | 32 | 34 | 35 | 40 | 37 | 36 | 38 | 34 |
| % possible Sunshine | 66 | 68 | 76 | 77 | 79 | 79 | 78 | 74 | 76 | 72 | 72 | 64 | 73 |
| Clear days | 13 | 11 | 13 | 13 | 13 | 15 | 13 | 14 | 14 | 17 | 15 | 14 | 165 |
| Partly cloudy days | 6 | 7 | 8 | 8 | 10 | 9 | 11 | 11 | 8 | 6 | 6 | 6 | 96 |
| Cloudy days | 12 | 10 | 10 | 9 | 8 | 6 | 7 | 6 | 8 | 8 | 9 | 11 | 104 |
| Days with fog | 7 | 6 | 4 | 3 | 3 | 1 | 1 | 1 | 4 | 5 | 5 | 7 | 47 |
|
Highest Temperature |
84 | 90 | 97 | 101 | 108 | 116 | 112 | 107 | 107 | 100 | 90 | 85 | 116 |
| Record hottest month, mean temp | 1953 51.9 | 1976 56.2 | 1974 62.7 | 1972 69.7 | 1996 81.1 | 1990 86.5 | 1998 86.9 | 1964 87.2 | 1977 82.1 | 1963 71.0 | 1965 57.4 | 1970 50.6 | Aug 1964, 87.2 |
|
Lowest Temperature |
-8 | -11 | 9 | 20 | 34 | 47 | 49 | 52 | 36 | 24 | 10 | -1 | -11 |
| Record coldest month, mean temp | 1949 35.2 | 1960 42.5 | 1969 47.5 | 1973 57.0 | 1992 68.0 | 1987 75.7 | 1976 75.8 | 1971 74.4 | 1974 67.8 | 1976 58.4 | 1972 46.4 | 1983 37.4 | Jan 1949, 35.2 |
| Avg Days above 90 | - | - | - | 4 | 12 | 22 | 26 | 24 | 12 | 3 | - | - | 102 |
| Avg Days below 32 | 19 | 12 | 6 | 1 | - | - | - | - | - | 7 | 17 | 62 |
| Jan | Feb | Mar | Apr | May | June | July | Aug | Sept | Oct | Nov | Dec | Annual | |
| Avg High | 60.8 | 65.7 | 73.5 | 80.3 | 85.3 | 91.8 | 95.0 | 95.3 | 89.3 | 81.7 | 71.9 | 63.5 | 79.5 |
| Avg Low | 37.9 | 41.3 | 49.7 | 58.4 | 65.7 | 72.6 | 75.0 | 74.5 | 69.2 | 58.8 | 48.8 | 40.8 | 57.7 |
| Avg Rain | 1.71 | 1.81 | 1.52 | 2.50 | 4.22 | 3.81 | 2.16 | 2.54 | 3.41 | 3.17 | 2.62 | 1.51 | 30.98 |
| Avg Snowfall | 0.5 | 0.2 | - | - | - | - | - | - | - | - | - | - | 0.7 |
| Avg Wind | NE/ 10.4 |
NE/ 11.5 |
SE/ 11.5 |
SE/ 11.5 |
SE/ 11.5 |
SE/ 11.5 |
SE/ 10.4 |
SE/ 10.4 |
SE/ 9.2 |
SE/ 10.4 |
S/ 10.4 |
NE/ 10.4 |
SE/ 10.8 |
| Max Wind speed | 51 | 56 | 64 | 47 | 55 | 51 | 54 | 49 | 71 | 44 | 52 | 48 | 71 |
| Avg T-storm Days | 1 | 2 | 3 | 4 | 7 | 4 | 4 | 4 | 4 | 3 | 2 | 1 | 37 |
| # Tornadoes in county 1950-2009 | - | 5 | 10 | 7 | 10 | 2 | 4 | 4 | 8 | 3 | 5 | 1 | 59 |
| Incidents in county w/ hail => 1.75" 1950-2009 | - | 9 | 10 | 25 | 46 | 7 | 3 | 2 | 2 | 4 | - | 2 | 110 |
| Avg relative humidity 3pm | 51 | 48 | 45 | 48 | 51 | 48 | 43 | 42 | 47 | 46 | 48 | 49 | 47 |
| Discomfort from heat/humidity | - | - | - | Mod | High | High | High | High | High | - | - | - | |
| Max UV Index | Mod | High | Very High | Very High | Extr | Extr | Extr | Extr | Very High | High | Mod | Mod | |
| % possible Sunshine | 47 | 51 | 57 | 56 | 56 | 67 | 75 | 74 | 67 | 64 | 54 | 48 | 60 |
| Clear days | 9 | 8 | 9 | 7 | 6 | 7 | 9 | 10 | 9 | 12 | 10 | 10 | 106 |
| Partly cloudy days | 6 | 6 | 7 | 8 | 11 | 15 | 15 | 15 | 12 | 10 | 7 | 6 | 118 |
| Cloudy days | 16 | 14 | 15 | 15 | 14 | 8 | 7 | 6 | 9 | 9 | 13 | 15 | 141 |
| Days with fog | 14 | 12 | 12 | 12 | 11 | 6 | 3 | 4 | 7 | 10 | 12 | 12 | 115 |
|
Highest Temperature |
89 | 100 | 100 | 100 | 103 | 107 | 106 | 108 | 111 | 99 | 94 | 90 | 111 |
| Record hottest month, mean temp | 1952 59.4 | 2009 62.9 | 1974 67.9 | 2006 76.7 | 1996 81.9 | 1990 87.4 | 2009 88.7 | 2009 88.3 | 2005 84.3 | 2004 76.9 | 1973 65.7 | 1970 60.1 | July 2009, 88.7 |
|
Lowest Temperature |
0 | 4 | 19 | 31 | 43 | 53 | 61 | 57 | 41 | 27 | 21 | 6 | 0 |
| Record coldest month, mean temp | 1978 43.3 | 1978 46.4 | 1969 54.9 | 1997 63.9 | 1976 71.3 | 1966 78.8 | 1976 79.8 | 1974 81.1 | 1974 72.3 | 1976 61.0 | 1976 52.1 | 1983 43.0 | Dec 1983, 43.0 |
| Avg Days above 90 | - | - | 1 | 2 | 9 | 22 | 28 | 28 | 18 | 4 | - | - | 113 |
| Avg Days below 32 | 8 | 5 | 1 | - | - | - | - | - | - | - | 2 | 6 | 22 |
Data source: National
Climatic Data Center
Interesting
Texas climate facts
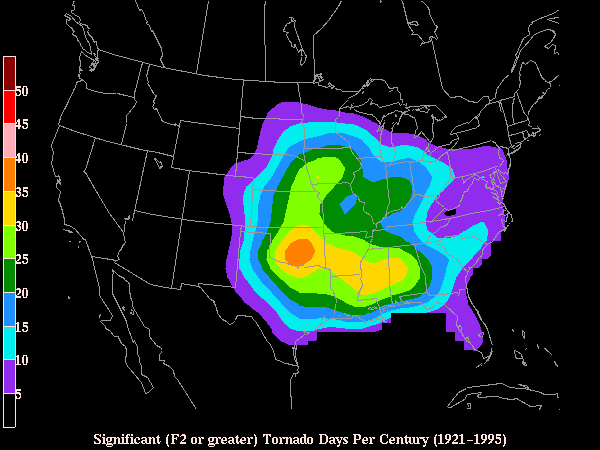
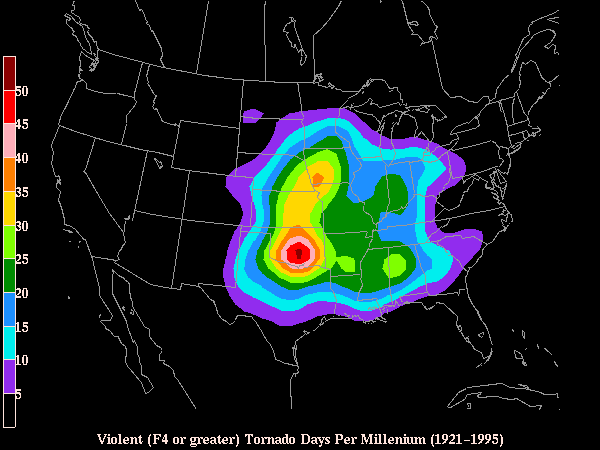
An average of 153 tornadoes touch down in Texas each year. Tornadoes may occur in any month, but occur most often during April, May and June between the hours of 4:00 p.m. and 8:00 p.m. In the period 1959-2000, 6417 tornadoes were reported in Texas, with 63% of tornadoes occurring from April-June and 33% occurring in May. From 1950-2007, Texas encountered 84 tornadoes with a strength of F4 or higher (winds > 207 mph). Texas ranks 11th among the 50 states in density of tornadoes with an average of 5.7 tornadoes per 10,000 square miles per year. The U.S. record for the fastest tornado winds occurred at Wichita Falls on April, 2 1958 with a top wind speed of 258 mph.
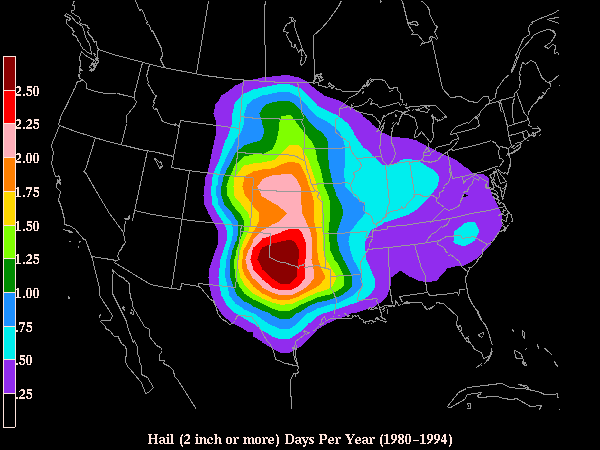
Hail is common with severe thunderstorms during the spring, mainly in North and Northwest Texas where 2.5 inch hail (tennis ball size) or greater occurs on the average of 2.5 days per year. During the period 1950-2007, Texas experienced 348 incidents of 4.0 inch hail (grapefruit size) or greater, causing $578 million in damage.
The coldest location in Texas is Stratford in the Texas Panhandle with an annual temperature of 55.0 F degrees. The hottest location is Mc Allen in the Texas Valley with an annual temperature of 74.6 F. The highest monthly average maximum temperature occurs during June in Presidio with 102.1 F, and the lowest monthly average minimum temperature occurs in Stratford during January with 18.7 F degrees. Texas has experienced 98 degrees or higher during every month of the year, The record highs for Texas from May through September are 116 degrees or above.
The average number of days between the first and last freeze of the winter season in Brownsville averages only 44 days, while Dalhart in the Texas Panhandle averages over four times as long with 189 days
The wettest location in Texas is Orange in southeast Texas with an annual precipitation average of 59.76 inches. The driest location is Socorro in Far West Texas, with an annual average of 7.68 inches.
Temperature and
precipitation records/averages for each U.S. state from coolweather.net
|
10
Sunniest Texas Cities |
|
| 1. El Paso | 84% |
| 2. Amarillo | 74% |
| 3. Lubbock | 72% |
| 4. Abilene | 70% |
| 5. Dallas/Ft. Worth | 61% |
| 6. San Antonio | 60% |
| 7. Corpus Christi | 60% |
| 8. Austin | 60% |
| 9. Houston | 59% |
| 10. Beaumont/Pt Arthur | 58% |
10 Windiest Texas Cities
Avg annual wind speed in mph1. Amarillo 14.3 2. Corpus Christi 13.8 3. Brownsville 13.7 4. Abilene 13.2 5. Lubbock 12.8 6. Dallas/Fort Worth 12.7 7. Wichita Falls 11.6 8. Waco 11.4 9. Midland/Odessa 11.3 10. San Antonio 10.8
Top 10 Texas tornadoes
and Top
10 climate extremes, Texas precipitation
records, Texas temperature
records, Texas all-time
weather records, current Texas weather, Texas
city
climate descriptions, Texas Tornado
and Severe Thunderstorm Watch climatology, average
freeze dates,
interesting Texas
weather facts, Texas weather
forecasts and Temperature / Precipitation records for each U.S.
state


